Показаны сообщения с ярлыком Infogram. Показать все сообщения

вторник, 18 февраля 2020 г.

Infographic: Happy 90th discovery anniversary, Pluto!


18.02.2020 by Kristine Spure


Do you ever gaze into space and wonder what lies beyond the edge of the observable? We definitely do. We can also only imagine what an indescribable feeling it must be to discover a new celestial object and be able to mark it on the sky map for the rest of the world to notice. 


It’s been 90 years since astronomer Clyde W. Tombaugh discovered Pluto at the Lowell Observatory in Flagstaff, Arizona. For a long time, Pluto was believed to be the 9th planet of our Solar System. But in 2006, just as other celestial bodies the same size of Pluto were discovered, it was demoted to a dwarf planet. 


Discover more statistics of Pluto and 10 important dates in the history of this unique and icy dwarf planet in our brand new insight report:

Infogram Insights offers you a deeper look at relevant, newsworthy topics – visualized with Infogram. Every week, we explore the data that is forever changing our world. Sign up or log in to Infogram to make an infographic like the one in this post!

Infographic: Happy 90th discovery anniversary, Pluto!

Do you ever gaze into space and wonder what lies beyond the edge of the observable? We definitely do. We can also only imagine what an indescribable feeling it must be to discover a new celestial object and be able to mark it on the sky map for the rest of the world to notice. 

It’s been 90 years since astronomer Clyde W. Tombaugh discovered Pluto at the Lowell Observatory in Flagstaff, Arizona. For a long time, Pluto was believed to be the 9th planet of our Solar System. But in 2006, just as other celestial bodies the same size of Pluto were discovered, it was demoted to a dwarf planet. 

Discover more statistics of Pluto and 10 important dates in the history of this unique and icy dwarf planet in our brand new insight report:

!function(e,t,s,i){var n=»InfogramEmbeds»,o=e.getElementsByTagName(«script»),d=o[0],r=/^http:/.test(e.location)?»http:»:»https:»;if(/^\/{2}/.test(i)&&(i=r+i),window[n]&&window[n].initialized)window[n].process&&window[n].process();else if(!e.getElementById(s)){var a=e.createElement(«script»);a.async=1,a.id=s,a.src=i,d.parentNode.insertBefore(a,d)}}(document,0,»infogram-async»,»//e.infogram.com/js/dist/embed-loader-min.js»);


Infogram Insights offers you a deeper look at relevant, newsworthy topics – visualized with Infogram. Every week, we explore the data that is forever changing our world. Sign up or log in to Infogram to make an infographic like the one in this post!

пятница, 14 февраля 2020 г.

How to write effective performance reviews for self-evaluation in 5 steps


14.02.2020 by Kristine Spure


Performance reviews (also called performance evaluations or performance appraisals) are crucial to understanding how an individual employee and the overall business achieved their goals, and where they may have fallen short.


Many people dread putting together their performance reviews. On the one hand, you want to showcase all the important goals that you’ve achieved. On the other hand, you don’t want to sing your own praises too loudly. 


Here’s a thing to keep in mind: Effective performance reviews will help you and your company grow. When done right, a good performance review will also help you get closer to what you want – whether it’s a pay raise, a promotion, or a bonus for that special project you worked especially hard on. This is your time to shine!


This article provides tips and tricks to help you ace your performance review in 5 steps. From self-evaluation techniques to customizable reports and infographics, there are several quick and easy techniques that will elevate your quarterly or annual performance review and help ensure future success.

Step 1: Self-evaluate


Afro-american woman writing in a notebook


Whether your company has a set template or not, start the performance review process by taking a look at the previous year’s projects, milestones, and significant completed tasks. Look through your online calendar month-by-month and make note of important events, meetings, or presentations from the year. 


Make a list of these accomplishments in chronological order and take note of key stakeholders for each project (we’ll cover the reason why in the next section).


Protip: To stay organized throughout the year and avoid unnecessary scramble, create a customizable dashboard or interactive report. This will allow you to quickly access and evaluate all your key milestones in one easy-to-access location.


Step 2: Highlight your accomplishments  


After compiling a list of major milestones, create a “done” list of all the deliverables, goals, and achievements. Reach out to key stakeholders for each project or event and ask for a few bullet points on how you contributed to the success or completion of the task.


Remember that it’s okay to put all your accomplishments on paper. It might seem like you’re bragging, but this is actually the time to finally pat yourself on the back. 


End-of-the-year performance reviews are an opportunity to share what you’ve excelled in and how you’ve driven your company’s profits. Just make sure you do it in a detailed way – using numbers, references, and the cause and effect of your actions. 


Protip: Create an email folder titled “Kudos” or “Gold Stars” (or any other name you wish) and file every positive email you receive from coworkers and clients throughout the year. At the end of the year, sort them by chronological order and use these direct quotes to help highlight your achievements in your performance review.

Step 3: Identify previous roadblocks


While it’s important to share everything positive that you’ve done for your company in your performance review, it’s also important to share where and when things went wrong. Identify projects or tasks that fell short of their desired goal and evaluate why this happened. 


When evaluating roadblocks, remember to: 


  • Offer concrete suggestions of what could have improved the outcome and how to solve these issues in the future

  • Share how you’ve learned from previous mistakes. You should articulate how you have grown from subpar situations

Identifying and understanding past failures will mitigate repeating the same patterns and mistakes. Own up to what went wrong and present a clear plan on how you moved forward.


Protip: It’s also helpful to reach out to key stakeholders and ask for their feedback on what they’ve learned from the same roadblock or unsuccessful project. Gaining insight from another point of view can provide additional actionable steps.

Step 4: Don’t forget the numbers


Numbers can tell an engaging and fascinating story. Reinforce your performance review by sharing the numbers that represent what you’ve accomplished. 


It’s important to make sure the numbers are presented in a way that will increase your employer’s, HR team’s, or stakeholder’s engagement. Move beyond static presentations and create interactive charts and graphs.


Here are some ways to use numbers to reinforce your successes in your annual performance review:


  • Choose SMART metrics (specific, measurable, achievable, relevant, and time-based) to help tell a success story

  • Share how many people were impacted by specific training or presentation and how that translated to increased sales or productivity

  • Gauge increased audience engagement and click-throughs or likes on social platforms and share how that boosted sales numbers

To breathe life into any dashboard, report, or slide presentation, you can even use interactive charts, maps, and infographics to increase audience engagement and make your self-evaluation pop. 


For example, infographics combine the best of both worlds – you can be creative and visual with your data, yet at the same time keep it professional. Infographics allow you to take a lot of complex information and present it in one easy-to-read and engaging place. 


Here’s an effective infographic on NBA star Kyle Korver’s achievements that combines both data and great visuals: 

Browse our infographics database for more inspiring examples. Get started today (no coding required!) and create your own infographic for your performance review.

Step 5: Focus on the future


an open notebook with the words 2020 Goals written


Now, it’s time to ask for what you want. Make a list of the future goals you’d like to achieve. Create an actionable “to-do” list. Ideas to add to your performance review include:


  • Ask to be added to specific projects to help develop certain skill sets that you want to improve

  • Map a clear plan to achieve a promotion. What steps must be taken and how can your manager support you in getting there?

  • Ask for a raise. Using numbers to reinforce how you’ve driven profits or retention for your company helps make a great case for a bump in salary


Final thoughts


Don’t put off completing your performance review until the last minute. Take your time to reflect on what you’ve achieved – and use your performance review as a chance to advocate for yourself at work.


And should your self-assessment performance review differ from your peer reviews, that’s okay, too. They might have a different perspective, but you can use the performance review conversation as a chance to provide context. Good luck! 

How to write effective performance reviews for self-evaluation in 5 steps

Performance reviews (also called performance evaluations or performance appraisals) are crucial to understanding how an individual employee and the overall business achieved their goals, and where they may have fallen short.

Many people dread putting together their performance reviews. On the one hand, you want to showcase all the important goals that you’ve achieved. On the other hand, you don’t want to sing your own praises too loudly. 

Here’s a thing to keep in mind: Effective performance reviews will help you and your company grow. When done right, a good performance review will also help you get closer to what you want – whether it’s a pay raise, a promotion, or a bonus for that special project you worked especially hard on. This is your time to shine!

This article provides tips and tricks to help you ace your performance review in 5 steps. From self-evaluation techniques to customizable reports and infographics, there are several quick and easy techniques that will elevate your quarterly or annual performance review and help ensure future success.


Step 1: Self-evaluate

Afro-american woman writing in a notebook

Whether your company has a set template or not, start the performance review process by taking a look at the previous year’s projects, milestones, and significant completed tasks. Look through your online calendar month-by-month and make note of important events, meetings, or presentations from the year. 

Make a list of these accomplishments in chronological order and take note of key stakeholders for each project (we’ll cover the reason why in the next section).

Protip: To stay organized throughout the year and avoid unnecessary scramble, create a customizable dashboard or interactive report. This will allow you to quickly access and evaluate all your key milestones in one easy-to-access location.


Step 2: Highlight your accomplishments  

After compiling a list of major milestones, create a “done” list of all the deliverables, goals, and achievements. Reach out to key stakeholders for each project or event and ask for a few bullet points on how you contributed to the success or completion of the task.

Remember that it’s okay to put all your accomplishments on paper. It might seem like you’re bragging, but this is actually the time to finally pat yourself on the back. 

End-of-the-year performance reviews are an opportunity to share what you’ve excelled in and how you’ve driven your company’s profits. Just make sure you do it in a detailed way – using numbers, references, and the cause and effect of your actions. 

Protip: Create an email folder titled “Kudos” or “Gold Stars” (or any other name you wish) and file every positive email you receive from coworkers and clients throughout the year. At the end of the year, sort them by chronological order and use these direct quotes to help highlight your achievements in your performance review.


Step 3: Identify previous roadblocks

While it’s important to share everything positive that you’ve done for your company in your performance review, it’s also important to share where and when things went wrong. Identify projects or tasks that fell short of their desired goal and evaluate why this happened. 

When evaluating roadblocks, remember to: 

  • Offer concrete suggestions of what could have improved the outcome and how to solve these issues in the future
  • Share how you’ve learned from previous mistakes. You should articulate how you have grown from subpar situations

Identifying and understanding past failures will mitigate repeating the same patterns and mistakes. Own up to what went wrong and present a clear plan on how you moved forward.

Protip: It’s also helpful to reach out to key stakeholders and ask for their feedback on what they’ve learned from the same roadblock or unsuccessful project. Gaining insight from another point of view can provide additional actionable steps.


Step 4: Don’t forget the numbers

Numbers can tell an engaging and fascinating story. Reinforce your performance review by sharing the numbers that represent what you’ve accomplished. 

It’s important to make sure the numbers are presented in a way that will increase your employer’s, HR team’s, or stakeholder’s engagement. Move beyond static presentations and create interactive charts and graphs.

Here are some ways to use numbers to reinforce your successes in your annual performance review:

  • Choose SMART metrics (specific, measurable, achievable, relevant, and time-based) to help tell a success story
  • Share how many people were impacted by specific training or presentation and how that translated to increased sales or productivity
  • Gauge increased audience engagement and click-throughs or likes on social platforms and share how that boosted sales numbers

To breathe life into any dashboard, report, or slide presentation, you can even use interactive charts, maps, and infographics to increase audience engagement and make your self-evaluation pop. 

For example, infographics combine the best of both worlds – you can be creative and visual with your data, yet at the same time keep it professional. Infographics allow you to take a lot of complex information and present it in one easy-to-read and engaging place. 

Here’s an effective infographic on NBA star Kyle Korver’s achievements that combines both data and great visuals: 

Browse our infographics database for more inspiring examples. Get started today (no coding required!) and create your own infographic for your performance review.


Step 5: Focus on the future

an open notebook with the words 2020 Goals written

Now, it’s time to ask for what you want. Make a list of the future goals you’d like to achieve. Create an actionable “to-do” list. Ideas to add to your performance review include:

  • Ask to be added to specific projects to help develop certain skill sets that you want to improve
  • Map a clear plan to achieve a promotion. What steps must be taken and how can your manager support you in getting there?
  • Ask for a raise. Using numbers to reinforce how you’ve driven profits or retention for your company helps make a great case for a bump in salary


Final thoughts

Don’t put off completing your performance review until the last minute. Take your time to reflect on what you’ve achieved – and use your performance review as a chance to advocate for yourself at work.

And should your self-assessment performance review differ from your peer reviews, that’s okay, too. They might have a different perspective, but you can use the performance review conversation as a chance to provide context. Good luck! 

четверг, 13 февраля 2020 г.

Valentine’s Day spending in the US (infographic)


13.02.2020 by Kristine Spure


The annual celebration of love is here, so get ready to be surrounded by a whole lot of roses, chocolates, and everything heart-shaped and pink. 


Even if you’re not a big spender yourself, plenty of Americans are. In 2019, Americans spent a record amount on Valentine’s Day – more than $20 billion in total. Greeting cards, candy, and a night out have been among the most popular gifts on Valentine’s Day. 


But what’s even more interesting is that Valentine’s Day actually originated as a Western Christian liturgical feast honoring the early saints named Valentinus. Take a look at our insight report for more shopping trends and historical facts: 

Infogram Insights offers you a deeper look at relevant, newsworthy topics – visualized with Infogram. Every week, we explore the data that is forever changing our world. Sign up or log in to Infogram to make an infographic like the one in this post!

пятница, 7 февраля 2020 г.

Infographic: The Oscars 2020 – who will win Best Picture?


07.02.2020 by Kristine Spure


The Academy Awards are just around the corner, and we’ll finally find out which of our favorite films from 2019 will take home the iconic Oscar statuette.


As always, the most intrigue surrounds the Best Picture category. Will the Oscar go to the Joker, the most-nominated film with 11 nominations in total? Perhaps Greta Gerwig’s coming-of-age period drama Little Women? Or maybe Parasite, the South Korean black comedy thriller?


In our latest insight report, we take a look at all the amazing films that will be competing in the Best Picture category this year, as well as all-time best film records.


Psst, who would win if you had the vote? 

Infogram Insights offers you a deeper look at relevant, newsworthy topics – visualized with Infogram. Every week, we explore the data that is forever changing our world. Sign up or log in to Infogram to make an infographic like the one in this post!

среда, 29 января 2020 г.

Infographic: The surprising stats of the Super Bowl


29.01.2020 by Kristine Spure


On February 2, 2020, all eyes will turn to the Super Bowl championship game in Miami. The San Francisco 49ers will play the Kansas City Chiefs to mark the end of the 100th season of the National Football League (NFL).


The Super Bowl is the culmination of a regular NFL season that begins in the late summer of the previous year. But over the years, it’s become so much more.


The Super Bowl has frequently been the most-watched American television broadcast of the year. With that in mind, it’s easy to understand why putting out a TV ad during the Super Bowl costs a not-so-small fortune.


Dive into stats about the Super Bowl in our insight report

Infogram Insights offers you a deeper look at relevant, newsworthy topics – visualized with Infogram. Every week, we explore the data that is forever changing our world. Sign up or log in to Infogram to make an infographic like the one in this post!

среда, 22 января 2020 г.

Infographic: The rise of remote work


22.01.2020 by Kristine Spure


Having a flexible schedule, more family time, the ability to travel – these are only a couple of the reasons why employees prefer working remotely. 


And by the looks of the statistics, it appears that remote working is quickly gaining steam around the globe. In a recent poll, nearly two-thirds of US workers said they work remotely at least some of the time. Many respondents noted that the ability to work remotely would make them happier and more likely to recommend the company to a friend. 


Not only does remote work deliver productive results to business owners – but it’s also good for the environment. Tons of greenhouse gases are avoided by working remotely and there are fewer traffic accidents. Explore the full scope of remote work statistics in this insight report

Infogram Insights offers you a deeper look at relevant, newsworthy topics – visualized with Infogram. Every week, we explore the data that is forever changing our world. Sign up or log in to Infogram to make an infographic like the one in this post!

пятница, 17 января 2020 г.

The 10 best Infogram projects of 2019


17.01.2020 by Kristine Spure


As the pace of the new year picks up and we’re taking in as many fresh ideas of the new decade as we can, it’s also time to reflect on what’s been achieved in 2019. 


It wasn’t easy picking just the top 10 projects — so many creators did an excellent job of visualizing data, shining the light on important topics, and increasing media and data visualization literacy.


But we put our heads together, counted the votes, and the results are in. 


Without further ado, here are the best Infogram projects of 2019! See our fantastic winners and get inspired. 


Click the images or arrows below to navigate and explore.


1. Customer loyalty in the local health system in the US


By NRC Health


This is by far one of the most extensive dashboard maps we’ve seen this year. At first glance, it might look like a single map – but it’s so much more. The main project has been hyperlinked to separate state-level dashboards. Explore the map by clicking the + icon and get an in-depth look into consumer trends and expectations, customer loyalty drivers, and more for each US state. 


Also, a round of applause to NRC Health for making the top 10 for the second year in a row! 

2. Chilling with Jens


By Danfoss 


Who said infographics can’t be used in podcasts? In this “Chilling with Jens” series, Danfoss Cooling invites you to discover the world of refrigeration with the help of podcast host Jens Andersen. He shares insights gained from over 40 years spent working in the industry. 


Each episode is embedded in the infographic and accompanied by fitting icons that reflect the topic of the episode. Bravo! 


3. It’s about time


By UNICEF


UNICEF’s “It’s about time” campaign focuses on supporting parents to bring up happy and healthy children and promoting family-friendly policies that would make a difference to family life. Check out their Mini Parenting Challenges (created using Infogram slides), learn tips for spending more quality time with your children, and discover how each activity benefits your relationship.


4. The state of gaming app marketing


By AppsFlyer 


Gaming is the main driving force in the app marketing economy, and there was a lot of growth in this sector in 2019. Much of the momentum can be connected to “hyper-casual” games (simple gameplay that can be played anywhere instantly). The genre erupted in the market in 2018 and continued to grow immensely in 2019. For other trends and statistics, explore the AppsFlyer 2019 report on gaming app marketing.


5. The Not Enough Impact report


By Amnesty International


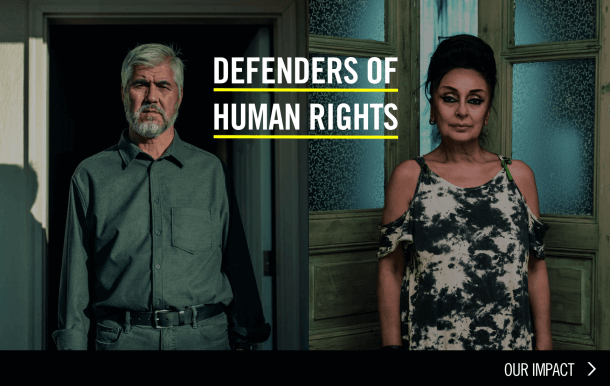
Amnesty International is a global movement of more than 7 million people who take injustice personally and who campaign for a world where everyone can enjoy basic human rights. In their “Not Enough Impact” report, they reveal 8 stories that celebrate the gains the movement has made, as well as the people that helped make them possible. See how they used slides to emphasize each individual’s personal story and impact. 


6. Private equity funding in Africa


By Private Equity International


According to the latest report by Private Equity International, Africa’s private equity is scaling up, with regionalization emerging as a key strategy. See where the activity is the highest and where the next opportunities might strike. Discover Africa, the world’s fastest-growing continent in 10 slides. Happy to see Private Equity International also making the top 10 second year in a row!

7. Let’s talk rockets and such


By News 6 WKMG


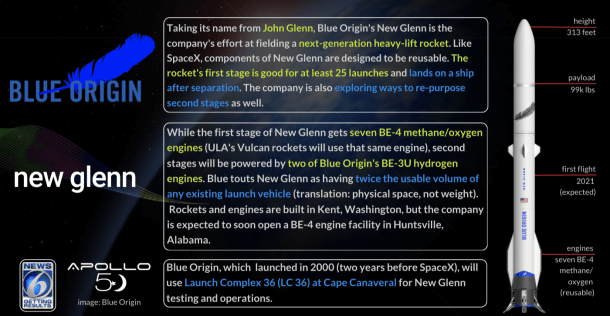
If you ever tried to keep up with Space 2.0, or America’s return to the Moon, you’ve undoubtedly encountered many names and a lot of rockets (and crew vehicles). Here’s an amazing interactive slideshow created by News 6 WKMG to help you catch up. 


8. SMB economic insights


By Lendio


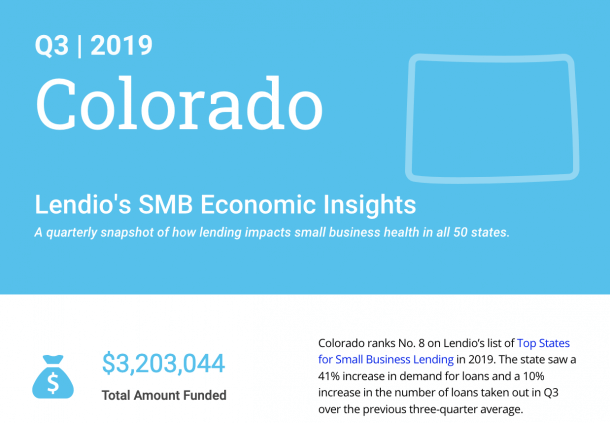
Every quarter, Lendio – the largest small business loan marketplace in the US – publishes a snapshot of how lending impacts small business health in all 50 states. Discover the statistics for each state and see how they compare to the national average on important lending metrics in their interactive infographic.


9. Fuel taxes in the EU


By the European Federation for Transport and Environment


Are Europeans paying more at the pump because of increasing taxes? How much more in taxes do petrol car drivers pay than diesel drivers, even though diesel engines are the main cause of the air pollution crisis in our cities? This interactive infographic by Transport and Environment collects data from all 28 EU member states since 1995 and displays it in an easy-to-understand way to answer all your questions.

10. 2019 annual report


By Church Pension Group


The Church Pension Fund has been operating since 1917 and was founded to ensure the highest possible level of financial security for retired clergy in the US. Their annual report includes messages from the people within the organization, an overview of the yearly highlights, as well as a financial snapshot of its assets. 


Feeling inspired? Create interactive, professional, and data-driven content just like this and make the top 10 project list in 2020. Get started now! 

понедельник, 13 января 2020 г.

Infographic: 2020 – International Year of Plant Health


13.01.2020 by Kristine Spure


This year, join the United Nations in celebrating 2020 as the International Year of Plant Health. There are 391,000 species of vascular plants currently known to science. By protecting plant health, we protect the food we eat, the air we breathe, and the environment that surrounds us. Simply put – by choosing to protect plant health, we protect life as we know it. 


As an individual, you can help protect the world’s crops, forests, gardens, and landscapes against invasive pests by gardening more. The latest stats show that younger households have reached an all-time high in gardening participation, with 18 to 34-year-olds now occupying 29% of all gardening households in the U.S.


Gardening has also been known to have numerous health benefits, like reducing stress, providing an extra dose of physical activity, and being present. So, make this year count and see if you can find your green thumb! 


Discover the world’s most naturally diverse regions and gardening traditions around the globe in our latest insight report

Infogram Insights offers you a deeper look at relevant, newsworthy topics – visualized with Infogram. Every week, we explore the data that is forever changing our world. Sign up or log in to Infogram to make an infographic like the one in this post!

Branding 101: why it’s important & how to get started


13.01.2020 by Kristine Spure


Imagine a company spending countless hours and money on a revolutionary new app. Now imagine you saw the app in the app store with a plain white background and Comic Sans font. 


Chances are you’d just completely ignore it, no matter how great the app actually was.


A company’s brand is the calling card to consumers; it’s their personality and quickly invokes their values. In seconds, it allows consumers to make a choice based on a feeling. If a logo or tagline is unattractive, unreadable, or cringingly tone-deaf in its message, consumers quickly move on to the next choice. 


Branding offers your potential customers consistency and recognition, which translates to increased loyalty and sales. If a brand cannot address their audience, the audience is gone. And today, with more options and savvier branding, that is happening more quickly than ever before.


Regardless of whether your company is brand new or has been established for years, it’s vital to ask the necessary questions when defining your brand. 


What is branding?



Branding is NOT just a nice logo. Your brand should also clearly communicate to your customers what they can expect from your company, how you’re differentiated from the competition, and what you value.  


Branding is an experience and a specific personality. 


Your brand cannot be all things to all consumers. Some basic questions to ask:


  • Are you a disruptor or are you reliable and steadfast? 

  • Are you new and innovative or do you have years of tried-and-true experience to back up your business’s claims? 

  • Are you affordable or high-end?  

There are no right answers – the important thing is to decide what your brand is, and stick with that decision. Customers will respond positively when they feel they can trust your company.


Your brand is a promise to your customers. So make sure to figure out answers to: 


  • What will the customers come to rely on from you? 

  • What will they feel when they think of you? 

  • How will you shape their day-to-day lives?

Why is branding important?


Regardless of generation, customers value stories more than ever and are drawn to brands that have a compelling one. As a business, your customers demand consistency in look, feel, and message. If your company cannot deliver on this branding, you will lose revenue. 


From Baby Boomers to Gen Z, enduring trends such as exploration and rediscovery, digital empowerment, convenience, mindfulness, and the desire to live well are fueling the consumption of brands.


Do NOT try and be everything to everyone. It’s impossible and you’ll fail, as customers will be able to sense dishonesty.


Establishing your brand identity



Once you’ve answered some of the basic questions around your brand, it’s time to go deeper. 


The following questions help customize your brand’s message to your customer base. It also allows employees to align with these ideas, and create a stronger voice and vision for the company.


Here are some helpful questions to ask yourself:


1. What is your brand mission?


Your mission statement should be action-oriented. This should encapsulate the purpose of your product/company. What are you making/supplying to customers? Why does it exist in the first place? Why is it a better option for consumers? Once those main points are defined, condense that into your mission statement. This should be no more than 1-2 sentences.


Some examples of successful mission statements: 


  • Patagonia: Build the best product, cause no unnecessary harm, use business to inspire and implement solutions to the environmental crisis.

  • Tesla: To accelerate the world’s transition to sustainable energy.

  • Prezi: To reinvent how people share knowledge, tell stories, and inspire their audiences to act.

2. What values do you want your customers to know you have?


Identifying core company values is key to keeping your brand on track. Beauty giant Sephora has seven key values: Passion, Innovation, Expertise, Balance, Respect for All, Teamwork, and Initiative. 


Business decisions are made with these values in mind. Using values to adhere to a brand’s identity strengthens the brand’s voice, appearance, and ability to connect with customers.


3. What exactly do you want someone to know about your brand? 


Keep it simple. This is your elevator pitch. Narrow down your story to four (or fewer) key sentences as an opener.


4. Who is your target demographic?


Know who you’re trying to reach. And again, don’t try to reach everyone. Determine who to target, what they love, and how they’ll be able to find you.


What’s next?



Once you’ve answered the basic questions of what your brand is, what your values are, and how to speak to customers, your design should reflect this. Your brand’s logo, fonts, and colors all play a huge part in telling a story. 


With Infogram’s cutting edge visualization tool, it’s super simple to get that consistent brand look. Our new branding feature allows members to set up a team and upload all branding assets (to create consistent content), and collaborate in real-time (helping everyone move forward more quickly).  


Get started with Infogram today and see your brand grow! 

пятница, 20 декабря 2019 г.

Infographic: World population in 2020


20.12.2019 by Kristine Spure


Can you imagine a time when there were only 5 million people in the whole wide world? That was the total world population in 8000 B.C., at the dawn of agriculture. 


Today, there are 7.7 billion people in the world, with more than 70% of them living in only 20 countries. What’s more, with the current average population increase at 82 million people per year, we might hit 10 billion inhabitants by 2050.


How will the world population grow in the next decades? Explore the predictions in our latest insight report

Infogram Insights offers you a deeper look at relevant, newsworthy topics – visualized with Infogram. Every week, we explore the data that is forever changing our world. Sign up or log in to Infogram to make an infographic like the one in this post!